

Table hockey statistics reveal patterns that transform how you understand this lightning-fast sport. While a match can swing from a 0-1 defensive battle to a 7-3 offensive showcase, the numbers behind player rankings, tournament performance, and match outcomes offer genuine insights. Whether you’re a beginner tracking your first wins or a seasoned competitor analyzing opponents, statistics provide the framework to decode what separates consistent performers from occasional winners. This guide explains how table hockey’s ranking system works, what metrics matter most, and how you can apply statistical thinking to elevate your game and deepen your appreciation of competitive play.
Table of Contents
- The Evolution Of Table Hockey And Its Competitive Structure
- Understanding Table Hockey Player Rankings And Tournament Points
- Analyzing Match Statistics And The Reliability Of Metrics
- Applying Table Hockey Statistics To Improve Your Game And Strategy
- Discover More Table Hockey Resources And Community Support
Key takeaways
| Point | Details |
|---|---|
| Rankings use weighted points | Tournament prestige and finishing position determine points awarded to players |
| Best 5 metric rewards consistency | Your top five tournament results combine to show sustained performance quality |
| Stats predict outcomes moderately | Higher-ranked players win about 65% of matches against lower-ranked opponents |
| Strategic tournament selection matters | Choosing events wisely maximizes point accumulation and ranking improvement |
The evolution of table hockey and its competitive structure
Table hockey transformed from casual basement entertainment to a globally organized sport with formal competition structures. The International Table Hockey Federation (ITHF) was established during the World Championship 2005 in Riga, Latvia, and now associates 21 national federations. This milestone created the foundation for standardized rules, official rankings, and consistent statistical tracking across international tournaments. Before this unification, players competed in regional events with varying formats and no universal measurement system.
The competitive landscape shifted dramatically when Sweden’s dominance ended with Finland’s gold in Riga 2005. Swedish players had controlled international table hockey for decades, but Finland’s breakthrough signaled that the sport was expanding beyond its traditional strongholds. This power shift sparked increased competition and raised the overall skill level across participating nations. Today’s statistics reflect a much more balanced competitive environment than existed in the sport’s early international years.
The sport has grown most notably across Northern and Eastern Europe, with Sweden, Finland, Russia, Czechia, Ukraine, and Latvia producing the majority of top-ranked competitors. Each country developed distinct playing styles and training approaches that show up in statistical patterns. Swedish players often emphasize defensive consistency, while Finnish competitors tend toward aggressive offensive play. These stylistic differences make statistical analysis more interesting because they reveal how different approaches to the game produce varying success rates in different tournament contexts.
Key factors driving table hockey’s statistical evolution include:
- Standardized tournament formats that allow meaningful comparison across events
- Digital record keeping that tracks every match result and player performance
- International competition bringing together players from different training backgrounds
- Growing prize pools and sponsorships that professionalize the sport
The table hockey scene in Europe continues expanding with new federations joining and younger players entering competitive ranks. This growth provides richer datasets for analysis and makes historical comparisons more meaningful. Understanding this context helps you appreciate why modern statistics offer more reliability than older records from less organized competitive eras.
Understanding table hockey player rankings and tournament points
Player rankings operate through a points system where tournament ranking and finishing position determine awards. Not all tournaments carry equal weight. World Championships award the most points, followed by continental championships, then national events and local competitions. A quarterfinal finish at the World Championship might earn more points than winning a regional tournament. This tiered structure ensures that rankings reflect performance against the strongest possible competition rather than just volume of wins at lower levels.
The Best 5 score sums your top five tournament results, emphasizing consistent performance across multiple events. This metric prevents players from achieving high rankings through a single exceptional performance followed by mediocre results. You must maintain quality play across several competitions to climb the rankings. The system rewards players who travel to major tournaments and consistently reach elimination rounds rather than those who dominate local events but avoid tougher competition.
Looking at 2024/25 rankings illustrates how points accumulate. Top-ranked players typically show Best 5 scores between 450 and 550 points, representing multiple deep runs in prestigious tournaments. Mid-tier competitors often range from 200 to 350 points, indicating solid performance at regional events with occasional strong showings at international competitions. Players below 150 points usually compete primarily at national or local levels with limited international exposure.
| Ranking Tier | Typical Best 5 Score | Tournament Profile |
|---|---|---|
| Elite (Top 20) | 450-550 points | Multiple World Championship appearances, consistent semifinals |
| Advanced (21-100) | 200-350 points | Regular continental events, occasional international podiums |
| Intermediate (101-300) | 100-200 points | National championships, selective international participation |
| Developing (301+) | Under 100 points | Local and regional events, building experience |
Strategically selecting tournaments maximizes point accumulation. Traveling to a continental championship where you might reach the round of 16 could yield more ranking benefit than winning three local tournaments. However, you must balance travel costs, time commitments, and realistic performance expectations. Entering events where you’re significantly outmatched provides minimal point opportunities and can damage confidence.
Pro Tip: Track which tournament levels match your current skill range by reviewing results from the past two seasons. Target events where players ranked within 50 spots of you regularly reach elimination rounds, giving you realistic chances to earn meaningful points while challenging yourself against slightly stronger competition.
Understanding this system helps you track your table hockey progress more effectively. Rather than focusing solely on win-loss records, monitor how your Best 5 score evolves over time. Steady growth in this metric indicates you’re competing at progressively higher levels and maintaining performance quality across multiple events.
Analyzing match statistics and the reliability of metrics
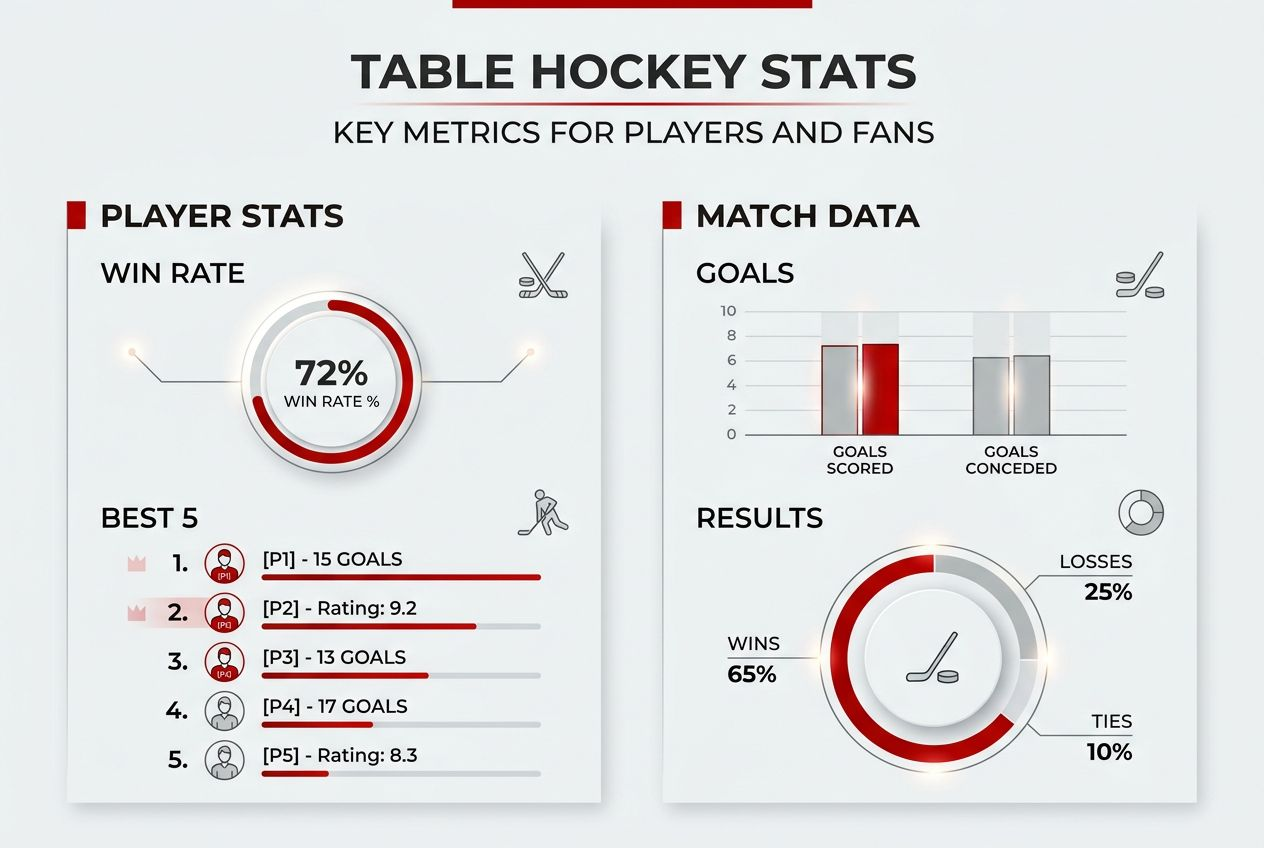
Match data reveals meaningful patterns when examined properly. Higher-ranked players win about 65% of matches against lower-ranked opponents, showing that rankings do correlate with outcomes but far from perfectly. This 65% figure reflects table hockey’s inherent randomness. A single lucky bounce, momentary lapse in concentration, or equipment quirk can shift momentum dramatically in a sport where possessions change rapidly and scoring chances come frequently.
Sample size fundamentally affects statistical reliability. A player with a 70% win rate over 10 matches tells you much less than one with 55% over 100 matches. The second player’s larger sample provides greater confidence that the observed rate reflects true skill rather than fortunate scheduling or temporary form. This principle applies across all table hockey metrics. Reliability increases with more samples, even in high randomness sports like hockey.
Goals per game, shooting percentage, and defensive metrics become meaningful only after sufficient data accumulation. A player scoring at 4 goals per game over 5 matches might simply have faced weak opponents or enjoyed favorable matchups. That same rate over 50 matches suggests genuine offensive capability. Statistical analysis uses measures like Cronbach’s Alpha to estimate reliability by testing internal consistency across different subsets of data.
Key considerations when interpreting table hockey statistics:
- Match context matters: tournament elimination games differ from group stage matches in intensity and strategy
- Opponent quality affects raw numbers: dominating weaker players inflates offensive stats artificially
- Playing style impacts metrics: defensive specialists naturally show lower goal totals than offensive players
- Equipment and table conditions introduce variables that don’t reflect player skill
Hot and cold streaks need statistical backing before being taken seriously. Winning five consecutive matches might indicate improved form or simply reflect favorable draws and opponent matchups. Cold streaks often reverse naturally through regression to the mean rather than requiring dramatic tactical changes. Smart players distinguish between meaningful performance trends and normal statistical variance.
“In table hockey, understanding the difference between skill-based patterns and random noise separates players who improve systematically from those who chase phantom problems. The sport’s fast pace creates many scoring chances, making individual game results less predictive than sustained performance across multiple events.”
Pro Tip: When reviewing your own statistics, compare performance against similarly ranked opponents specifically. Your overall win rate might look poor if you regularly challenge higher-ranked players for experience, but your rate against peers could show steady improvement that better reflects developing skill.
This analytical approach helps you master advanced table hockey skills by identifying which aspects of your game genuinely need work versus which show natural variance. Focus improvement efforts on areas where statistics consistently underperform across large samples rather than reacting to short-term fluctuations.
Applying table hockey statistics to improve your game and strategy
Translating statistical knowledge into practical advantage requires systematic thinking. Understanding tournament weights and rankings is crucial for maximizing point accumulation and ranking improvement. Build your competitive calendar around events that offer the best return on investment considering entry fees, travel costs, and realistic performance expectations based on your current ranking and skill level.
-
Map your tournament strategy by identifying 3-5 target events per season that match your competitive level. Review past results to find competitions where players ranked within 30 spots of you regularly reach quarterfinals or semifinals. These represent your optimal point-earning opportunities.
-
Monitor your Best 5 scores monthly and calculate the minimum performance needed at upcoming tournaments to improve this metric. If your fifth-best score is 45 points, any tournament where you can realistically earn 50+ points deserves priority consideration.
-
Analyze opponents’ statistics before important matches by reviewing their recent results, preferred playing style, and performance trends. A player on a three-tournament winning streak likely brings strong confidence and form, while someone struggling might be vulnerable to aggressive early pressure.
-
Track your own performance across seasons to identify patterns in strengths and improvement areas. Create a simple spreadsheet logging goals scored, goals allowed, win rate by opponent ranking tier, and tournament finish positions. Review this data quarterly to spot trends invisible in individual match results.
-
Use statistical insights to adjust training focus based on identified weaknesses. If your defensive statistics consistently lag offensive numbers against similarly ranked opponents, dedicate more practice time to positioning and reaction drills rather than shooting technique.
-
Develop pre-match preparation routines that incorporate opponent research. Spend 15 minutes before each tournament match reviewing your opponent’s ranking, recent results, and any available video footage to identify tactical opportunities.
The key to effective statistical application lies in balancing data-driven decisions with intuitive gameplay. Numbers inform strategy but shouldn’t paralyze decision-making during matches. Use statistics primarily for preparation, post-match analysis, and long-term planning rather than trying to calculate probabilities mid-game. The sport moves too quickly for real-time statistical processing.
You can track your table hockey progress more effectively by maintaining detailed records that go beyond simple win-loss tallies. Document specific aspects like first-period performance, ability to protect leads, and success rate in comeback situations. These granular metrics reveal tactical strengths and weaknesses that overall statistics might obscure.
Combine statistical analysis with video review when possible. Numbers tell you what happened, but video shows how and why. A poor shooting percentage might result from taking low-quality shots, facing exceptional goaltending, or experiencing equipment issues. Video context helps you interpret statistics correctly and focus improvement efforts appropriately.
Advanced players master strategic approaches by using statistics to identify opponent tendencies and exploit patterns. If an opponent’s statistics show consistent struggles in third periods, you might adopt a conservative first-half strategy to stay close, then apply pressure when they typically weaken. This tactical application of statistical knowledge provides competitive edges that raw skill alone cannot achieve.
Discover more table hockey resources and community support
Taking your statistical understanding to the next level means connecting with resources that support continuous improvement. Table Hockey Global offers comprehensive guides covering everything from fundamental techniques to advanced competitive strategies. Whether you’re analyzing your first tournament results or refining tactics for international competition, you’ll find practical advice tailored to your current skill level.

The platform provides detailed guidance on mastering advanced play that complements statistical analysis with tactical execution. Understanding what the numbers say matters little if you can’t translate insights into improved performance. Expert tutorials show you how to convert statistical knowledge into concrete gameplay adjustments that produce measurable results.
Track your progress systematically using proven frameworks developed by experienced competitors. The community includes players at every level, from beginners recording their first wins to professionals competing for world championships. This diversity creates learning opportunities where you can both teach and learn, sharing your statistical insights while gaining perspective from others’ analytical approaches.
FAQ
What are the basic statistics used in table hockey?
Common statistics include player ranking points, win-loss records, goals scored and allowed, and Best 5 tournament scores. These metrics assess performance over time and across different competition levels. Additional stats like shooting percentage and average goals per game provide deeper insight but require larger sample sizes for reliability.
How does the Best 5 scoring system affect player rankings?
The Best 5 system sums your top five tournament results, crucial for overall rank calculation. It encourages players to perform consistently across multiple events rather than relying on one exceptional showing. This approach rewards players who regularly compete at high levels and maintain quality performance throughout a season.
Can I use table hockey statistics to predict match outcomes?
Rankings improve prediction accuracy but aren’t guarantees due to the game’s inherent randomness. Statistics show about 65% win probability for higher-ranked players versus lower-ranked opponents. This moderate correlation means upsets occur frequently enough that statistical favorites lose roughly one-third of the time, making every match competitive regardless of ranking differences.
Where can I find official table hockey stats and rankings online?
Official rankings and tournament results appear on ITHF and World Tour websites. These sources update regularly after tournaments, providing current player standings, historical results, and detailed point breakdowns. National federations often maintain additional statistics specific to their domestic competitions and players.
Recommended
- Master advanced table hockey play: skills and strategies 2026 – Table Hockey Global
- Table Hockey in Europe: Your Guide to the Thriving Scene – Table Hockey Global
- Track table hockey progress and improve your game in 2026 – Table Hockey Global
- Common table hockey penalties: rules and tips for fair play – Table Hockey Global
- Player feedback methods basketball coaches use in 2026 – Hoop Mentality